
The picture only comes together in Excel – if at all?
- Revenue is in the invoicing tool, effort in the planner, cost in a spreadsheet – never in one place.
- By the time you stitch the numbers together by hand, they're stale and you don't fully trust them.
- You find out a project was loss-making after the fact – when you can no longer step in.
One dataset, every report
All data in one place
Planning, time logs and invoices live in the same system, so reports build themselves and stay up to date automatically.
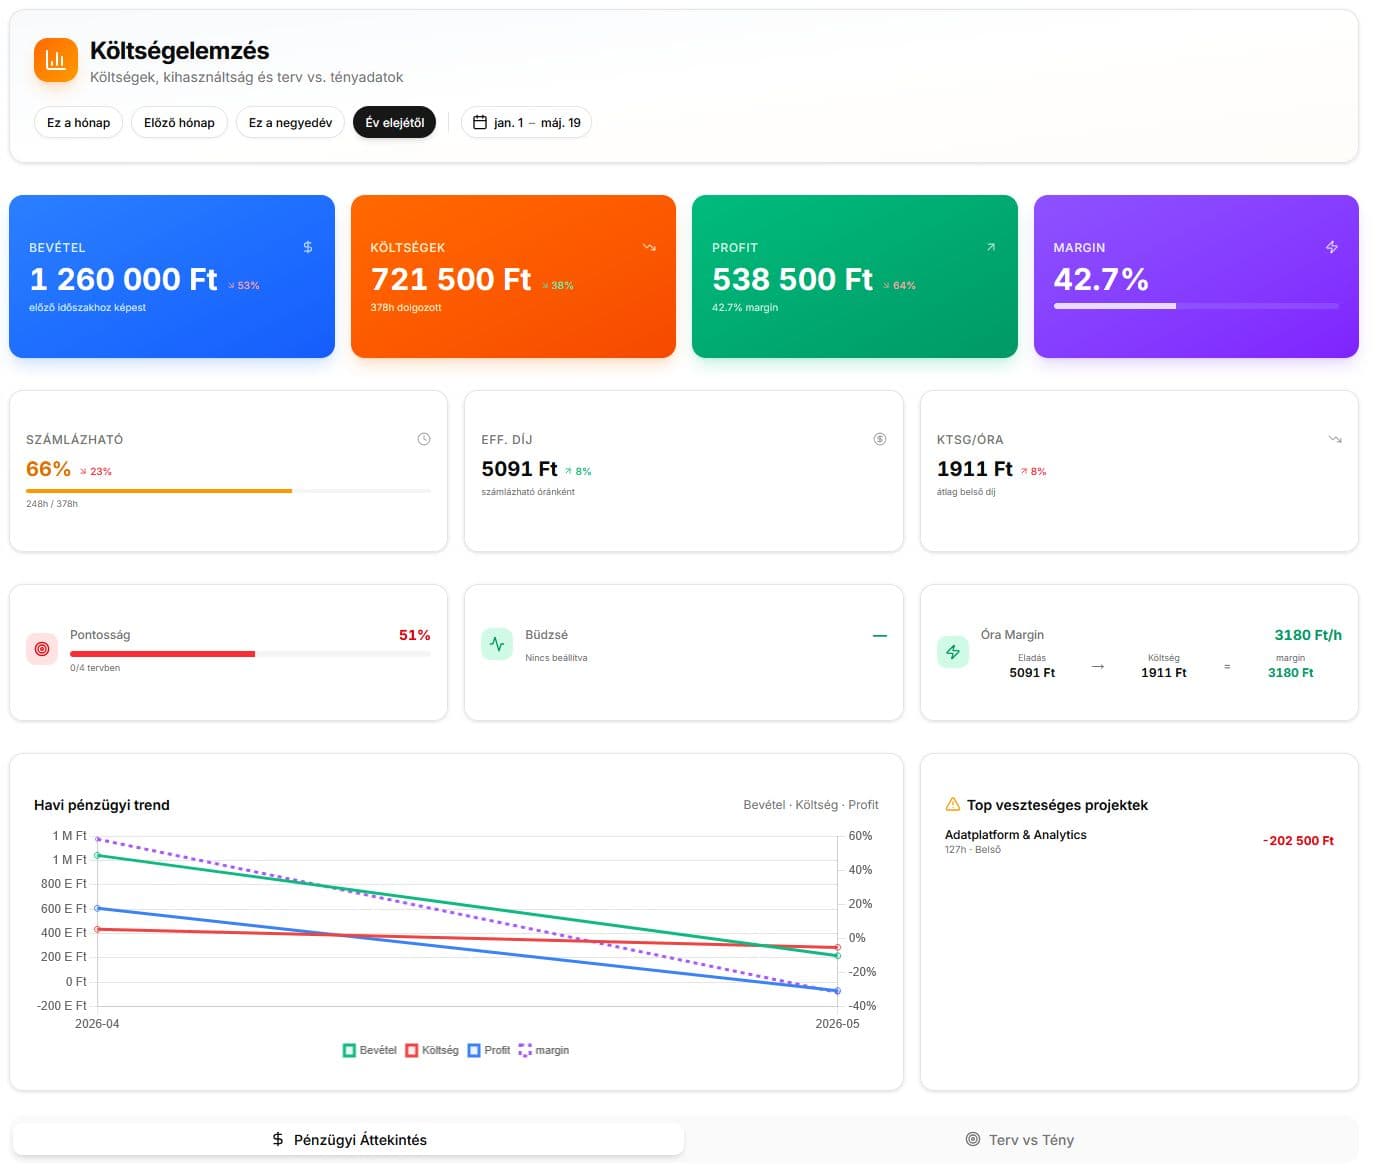
See the project's real margin
Invoiced revenue and the salary-based cost of logged hours in one view – broken down by project, team or period.
Decide from data, not gut feeling
An executive dashboard with the key KPIs, cashflow and capacity reports – see where the company stands in seconds.
What you gain
Transparent profitability
See at the project level what makes money and what drains it – in time, not in hindsight.
No manual work
No more exporting and stitching: reports refresh themselves from the daily work.
Confident leadership decisions
Numbers based on a single source of truth that you can actually build a strategy on.
Wohlflow's modules give you the full picture together.
Capacity planner
Visual drag & drop capacity and resource planning with a real-time overview.
Learn moreSkills matrix
Your team's skills, seniority levels and experience in one transparent matrix.
Learn moreTicketing & client portal
Built-in ticketing and a client portal, in sync with capacity planning.
Learn moreFrequently Asked Questions
You might have a few more questions. We're here to help!